
What a Cross Country 5K Tells You About Spring Track

Charlotte won the Division I girls race at the New Hampshire cross country championships as a junior. She ran 19:14. A year later she ran the same course in 20:08 and finished tenth.
Put that 20:08 into a race calculator and it says her spring 1600 should be about 5:51. That is not a bad calculator. It is Jack Daniels’ VDOT math, the same math behind most race predictors, including the conversions in my own P-Scale pace calculator.
In May she ran 4:59.81.
The clock didn’t show us her true fitness. It didn’t tell us that she was sick that day. Race times are a snapshot of a single competition, not a verdict on an athlete’s ability or potential.
The math was right. The input was wrong. A November cross country 5K is not the flat, accurate 5K a calculator assumes, and November is six months before May.
I wanted to know whether Charlotte was an exception. New Hampshire runs every divisional cross country championship on one course, which makes it a clean test. So I followed eleven years of those runners to the same athletes’ 1600 and 3200 at the divisional track championships the next spring. 1,608 fall-to-spring pairs. She was not an exception. She was the pattern, a little louder than usual.
The numbers come from New Hampshire. The lesson does not depend on it. Most championship courses have hills, turns and a crowded start, and every runner has a winter between November and May.
The short version. A championship cross country 5K undersells spring track. Fed into a race calculator, it set the spring 1600 goal 23 seconds too slow for the typical boy and 34 seconds too slow for the typical girl, and 98% of the runners who made a spring 1600 final beat it. The better rule, from a slow championship course: a spring 1600 runs about 26.5% of the cross country time, and a 3200 about 58%. Use a range, not one number. Adjust for your course. Read it against the year.
Cross Country to Track Goal Calculator
Enter a championship 5K and pick whether the race ran fast, average or slow. Get the floor, target and stretch for the spring 1600 and 3200, the race calculator’s number beside them, and the P-Scale paces for March. Paste a roster and it sets goals for the whole team.
Open the calculatorWhat is in this article
Why race calculators get cross country wrong
Every race calculator makes the same two assumptions. Your November 5K breaks both.
It assumes a flat, accurate course. Daniels built VDOT from track and road races. A cross country championship course has hills, grass, mud, tight turns and a start that funnels a full field into a single path. Every one of those adds time to a flat 5K. Most coaches have never measured how much their course adds.
It assumes the race was run today. A calculator converts one performance into an equivalent performance at the same fitness. Your athlete will not have the same fitness in May. Between the last cross country race and the spring championship sit six months of growth and a winter of training. For a fifteen-year-old, six months is a lot.
Both errors point the same way. The calculator sets the spring goal too soft. A goal that soft is not neutral. An athlete who hits a soft goal in April thinks the season is done, and a coach who believes it trains the wrong athlete.
What 1,608 runners actually ran
New Hampshire runs all three divisional cross country championships on one course, Derryfield Park in Manchester, on the last Saturday of October. It is a fair course, and it runs slow. The divisional track championships follow in late May or early June. Lancer Timing posts both, which makes it possible to follow the same runners from one fixed course to the spring.
I matched them for eleven school years, 2014-15 through 2025-26, skipping 2019-20 when the spring season was cancelled. That is 1,608 fall-to-spring pairs from 824 runners, boys and girls, 1600 and 3200. Then I ran each cross country time through the same VDOT math a race calculator uses and compared the prediction with what the runner actually ran.
| Faster than the race calculator said (median) | Beat the race calculator | Spring time as a share of the 5K | |
|---|---|---|---|
| Boys 1600 | 23 seconds | 98% | 26.7% |
| Boys 3200 | 36 seconds | 91% | 58.4% |
| Girls 1600 | 34 seconds | 98% | 26.4% |
| Girls 3200 | 49 seconds | 91% | 58.2% |
Read the first column as the size of the mistake. A race calculator missed the typical boy’s 1600 by 23 seconds and the typical girl’s by 34. In the 3200 it missed by more.
The typical boy
Jack sits close to the exact middle of that table. As a junior he ran 16:38 at the state meet and finished tenth in Division I. A race calculator turns 16:38 into a 4:48 1600. That spring he ran 4:26.68 at the divisional championship and finished third. He beat the prediction by 21 seconds. The typical boy beat it by 23.
Jack was not a phenomenon in that race. He was the median. That is the point. If your best junior runs 16:38 in November and you tell him 4:48 is a good spring goal, you have set the bar 21 seconds under what he actually ran.
If you know Jack’s name, it is from the 4×800 that won the state title in 2019. Same spring.
The ladder: floor, target, stretch
One number is the wrong answer to “what should I run this spring?” The data gives three.
- Target is what the median runner from that cross country band ran in the spring.
- Floor is the slower quarter’s mark. Three in four runners from that band ran faster.
- Stretch is the faster quarter’s mark. One in four got there. It is real, and it is not the plan.
The last column is the share of every runner in that band who went on to make a spring divisional final in the 1600 or 3200. Where it is high, the row describes nearly everyone. Where it falls below about a third, the row describes only the runners who made it. That flatters the band, so those rows are in italics.
These numbers come from a slow course. If your race ran faster, read Adjust for your course before you use them.
Boys
| Championship 5K (slow course) | 1600: target (floor to stretch) | Race calculator | 3200: target (floor to stretch) | Race calculator | Made a spring final |
|---|---|---|---|---|---|
| Under 16:30 | 4:25 (4:29 to 4:22) | 4:41 | 9:39 (9:52 to 9:31) | 10:02 | 83% |
| 16:30 to 17:00 | 4:30 (4:37 to 4:25) | 4:50 | 9:51 (10:10 to 9:42) | 10:24 | 56% |
| 17:00 to 17:30 | 4:40 (4:45 to 4:31) | 5:00 | 10:04 (10:17 to 9:55) | 10:40 | 47% |
| 17:30 to 18:00 | 4:44 (4:50 to 4:39) | 5:09 | 10:25 (10:41 to 10:05) | 10:59 | 34% |
| 18:00 to 18:30 | 4:50 (4:56 to 4:43) | 5:17 | 10:31 (10:51 to 10:20) | 11:19 | 20% |
| 18:30 to 19:00 | 4:51 (4:59 to 4:44) | 5:24 | 10:41 (10:55 to 10:25) | 11:37 | 11% |
Girls
| Championship 5K (slow course) | 1600: target (floor to stretch) | Race calculator | 3200: target (floor to stretch) | Race calculator | Made a spring final |
|---|---|---|---|---|---|
| Under 19:00 | 5:08 (5:13 to 4:54) | 5:23 | 11:00 (11:13 to 10:41) | 11:33 | 86% |
| 19:00 to 19:30 | 5:13 (5:23 to 5:09) | 5:37 | 11:26 (11:44 to 11:17) | 12:00 | 74% |
| 19:30 to 20:00 | 5:20 (5:25 to 5:12) | 5:46 | 11:37 (11:53 to 11:17) | 12:17 | 64% |
| 20:00 to 20:30 | 5:29 (5:40 to 5:20) | 5:53 | 11:51 (12:06 to 11:36) | 12:32 | 54% |
| 20:30 to 21:00 | 5:29 (5:41 to 5:24) | 6:03 | 12:14 (12:41 to 11:50) | 12:55 | 40% |
| 21:00 to 21:30 | 5:37 (5:50 to 5:25) | 6:12 | 12:18 (12:38 to 12:01) | 13:14 | 36% |
| 21:30 to 22:30 | 5:46 (5:55 to 5:36) | 6:25 | 12:43 (13:04 to 12:17) | 13:42 | 24% |
Slower bands are left out because so few of those runners made a spring final. The calculator reads a minute past each table and flags the result.
Charlotte’s senior year sits in the 20:00 to 20:30 row. For her 20:08 the race calculator said 5:51. The row’s target said 5:29. She ran 4:59.81, past the stretch. That is what a stretch looks like when it happens.
Adjust for your course
The tables come from a slow course. If your course runs faster, a 17:00 on it is worth less than a 17:00 on New Hampshire’s. There are two ways to adjust.
The quick way: fast, average or slow
New Hampshire gave me a clean measure of how much a course matters. One week after the divisional meet, the state Meet of Champions runs on a fast course. I matched 2,670 pairs of those races: the same runner, one week apart, both at championship effort. On the fast course, boys ran about 2.5% faster and girls about 3.5% faster. That is roughly 25 and 45 seconds.
So before you read the tables, add 2.5% to a boy’s time from a fast course and 3.5% to a girl’s. Add half that for an average course. Add nothing for a slow one.
- A boy who ran 17:00 on a flat, fast course reads as about 17:26. He sits in the 17:00 to 17:30 row: target 4:40 for the 1600, 10:04 for the 3200.
- A girl who ran 19:40 on a fast course reads as about 20:21. She sits in the 20:00 to 20:30 row: target 5:29 and 11:51.
Judge the race, not just the course. A flat course in mud and wind runs slow. A hilly course on a cool, dry day can run average. Ask how the front of the field ran that day against other years on the same course.
Fast, average or slow, then the whole ladder
The Cross Country to Track Goal Calculator makes this adjustment for you, reads the curve to the second instead of in 30-second bands, and flags any time where the data is thin.
Set spring goals from a 5KThe better way: build your own table
The New Hampshire table is exact for one course. Your championship course in Ohio, Texas or Oregon has its own table. The method transfers, and it takes one evening.
- Pick one race your team runs every fall. Your conference or state championship is best: same course, same week, full effort.
- Pull three to five years of results for it. Most are on athletic.net or MileSplit.
- Find the same runners’ spring 1600 and 3200. Use one championship meet, not season bests. Season bests come from your fastest race on your best day, and they make every goal too ambitious.
- Divide each spring time by that runner’s fall time. Take the median for each group: boys 1600, boys 3200, girls 1600, girls 3200.
- Multiply this fall’s 5K by your medians. That is the target. The middle half of your ratios gives the floor and the stretch.
Twenty pairs per group pins the median within about 5 seconds for boys and 7 for girls. Thirty is better. A small program can pool five years to get there.
Two cautions from the New Hampshire data. The ratio runs a little higher for your fastest runners: their spring time is a slightly bigger share of their 5K. And the slowest runners who make a spring final post the lowest ratios, because only the ones who improved most got there. Do not apply a ratio built from finalists to a runner who will not be one.
Read the year, not just the clock
The same time on the same course is not the same race every year. Here is the front of the New Hampshire field on one championship course, every fall for eleven years.
The front of the field, fall by fall
Median of the top 25 finishers in each division, three divisions, same course. Seconds slower than that group’s fastest fall.
Source: Lancer Timing NHIAA divisional results, falls 2014 to 2025. Fall 2019 is not in the data set.
See the numbers
| Fall | Boys | Girls |
|---|---|---|
| 2014 | +8 s | +24 s |
| 2015 | +0 s | +6 s |
| 2016 | +5 s | +0 s |
| 2017 | +17 s | +10 s |
| 2018 | +28 s | +31 s |
| 2019 | no data | no data |
| 2020 | +21 s | +64 s |
| 2021 | +34 s | +38 s |
| 2022 | +14 s | +40 s |
| 2023 | +23 s | +68 s |
| 2024 | +42 s | +90 s |
| 2025 | +33 s | +67 s |
The front of the girls’ field ran about 90 seconds slower in 2024 than in 2016. The boys’ ran 42 seconds slower than their fastest fall. Weather, footing and course changes all land in that number, and results alone cannot say which.
The spring numbers follow it. After the slowest falls, runners beat the race calculator by the most. Girls beat it by a median 64 seconds after fall 2024, against 26 after fall 2021.
Charlotte’s two Octobers sit on that chart. The front of the girls’ field ran about 28 seconds slower in 2023 than in 2022. She ran 54 seconds slower. Part of her 20:08 was the course that day, not her.
So before you set a goal from a championship time, check how the front of the field ran that year against other years. A slow year makes every runner’s time undersell them a little more.
Freshmen and girls need wider ranges
Two groups break the average more than the rest.
Younger runners beat the race calculator by more. They have more growing ahead of them, and it shows most in the boys’ 3200. Freshman boys beat the prediction by a median 49 seconds. Seniors beat it by 32. For girls in the 1600 the same pattern runs from 39 seconds as freshmen to 29 as seniors.
Girls have a bigger range. Around the typical 1600, 59% of boys landed within 10 seconds of the target. Only 41% of girls did. A single number will be wrong for most girls, in both directions. That is not a reason to give girls lower goals. It is a reason to give them a range and to adjust it early in the spring, when real track times arrive.
Charlotte’s own two years show it. As a junior she beat the race calculator by 11 seconds. As a senior she beat it by 51. Same athlete, same course, same coach.
From November to May
The ladder tells you where an athlete could be in May. It does not tell you how to train in December. Those are different questions, and mixing them up is how winters go wrong.
November to March: the bridge
Do not train off the spring target in December. An athlete running May goal pace in the snow is training for the wrong race. Winter is for volume, strength and patience, set by how much the athlete ran in cross country, not by what they might run in the spring.
Set each athlete’s break, path and level in the end of season meeting. Then run the twenty weeks in the winter training guide.
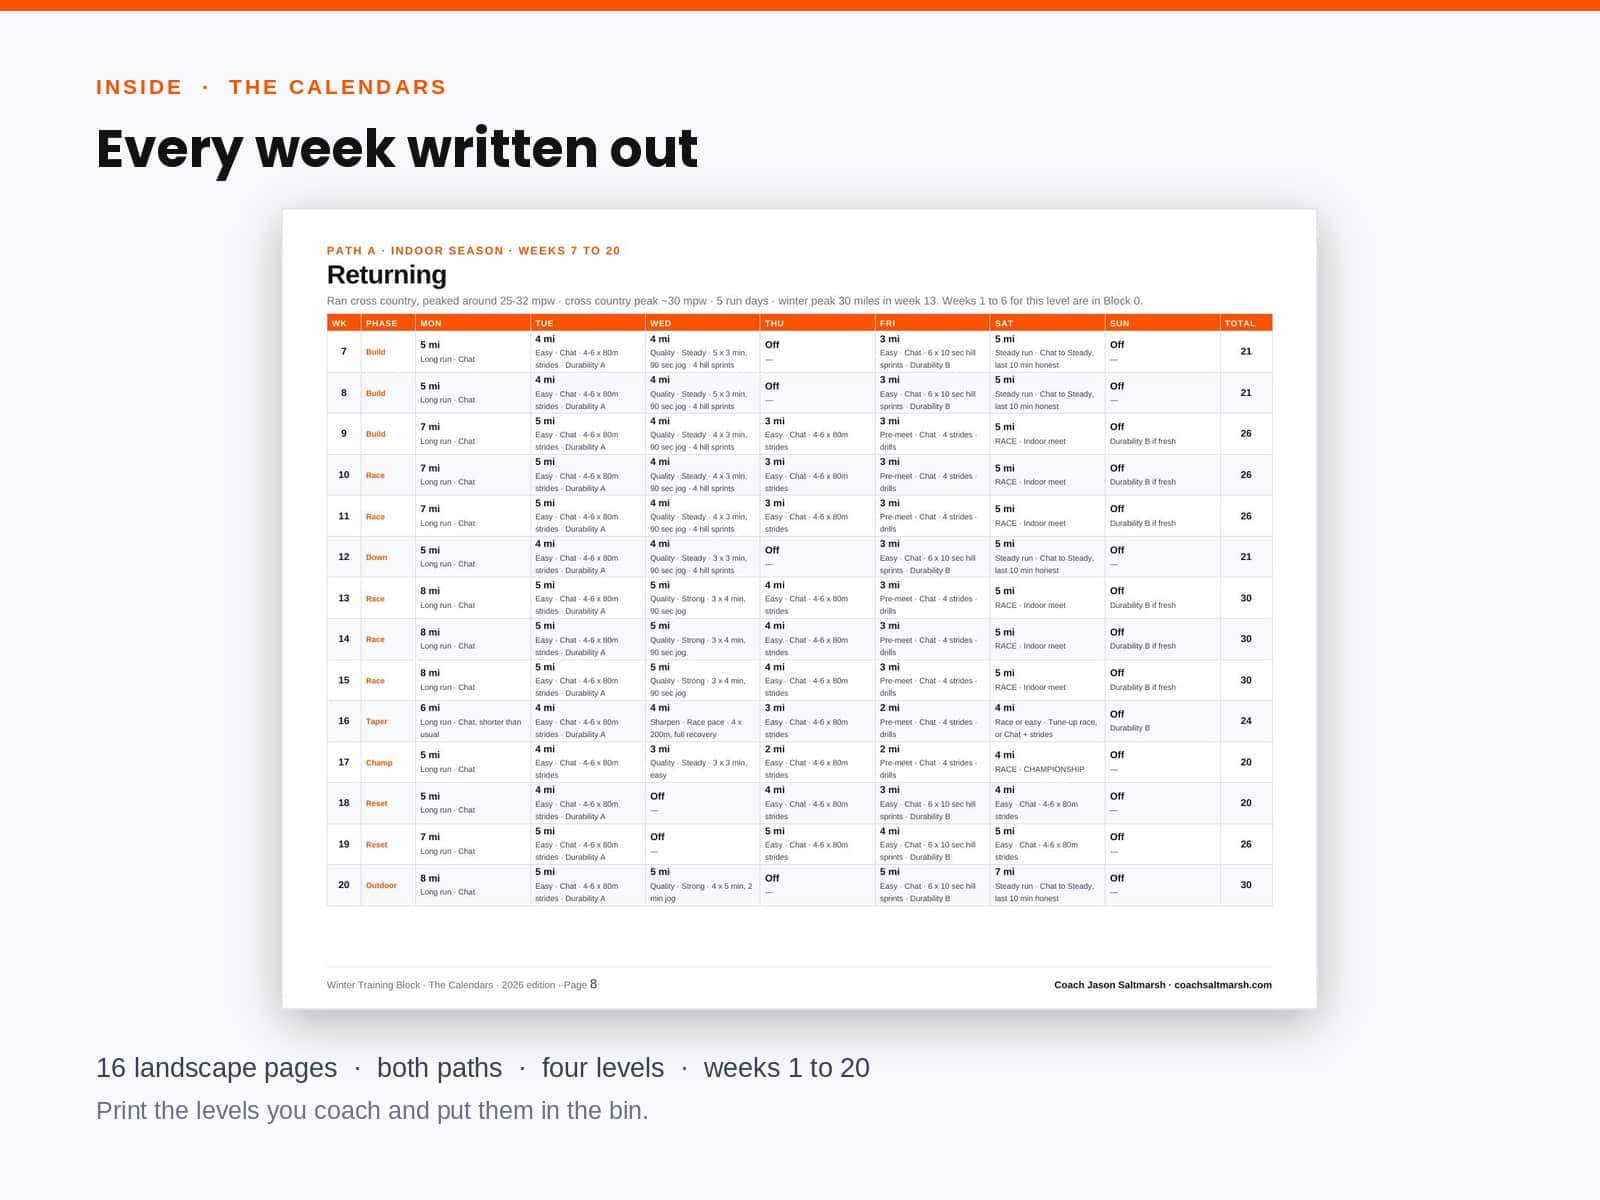
The Winter Training Block
Twenty weeks written out day by day. Two paths depending on whether your program races indoors, four levels set by cross country peak week, and every session from the break to the first outdoor practice.
Get the Winter Training Block · $59Instant download · 30-day guarantee
March: the handoff
The ladder comes back in March. This is where it plugs into the P-Scale, my pace system for the 800, 1600 and 3200. Every P-Scale zone is a percent of one number, P100, the athlete’s current 1600 race pace.
- The floor sets P100 for the first weeks of spring. It is the conservative number, and that is the point. A boy in the 17:00 to 17:30 row trains from 4:45. That puts P80 threshold at 85.5 per 400 and P90 at 78.4.
- The target sets goal pace. His rolling 200s and his 1000 readiness check run at 4:40 pace, 70.0 per 400.
- The stretch stays in your head. If he is ahead of the target by April, the stretch tells you how far ahead is realistic.
- Replace the floor with a race as soon as one exists. The first indoor 1600 or the first outdoor meet. From then on the P-Scale runs on real times, and the November 5K has done its job.
The free 1600m, 3200m and 800m pace calculators turn the floor into every zone and every rep split.
The spring that follows
The P-Scale Track Bundle is the 800m, 1600m and 3200m plans: twelve weeks each, four levels, and every rep with each athlete’s split beside it. Each plan includes the full calculator. Enter one race and one goal per athlete in March, and every rep gets its split.
One purchase covers your whole staff and team.
Get the P-Scale Track Bundle · $99 See the 1600m planInstant download · 30-day money-back guarantee · Each plan alone is $39
Common questions
How do I convert a cross country 5K to a mile time?
For a spring 1600, start at about 26.5% of a championship cross country 5K from a slow course. For a 3200, about 58%. If the race ran faster, add 2.5% to a boy’s 5K or 3.5% to a girl’s first, or half that for an average course. Use the result as a target with a range around it, not a single number.
Are 5K race calculators accurate for cross country times?
They are accurate for a flat, accurate 5K converted to a race run at the same fitness. A November cross country 5K is neither. On a slow championship course, a race calculator set the spring 1600 goal 23 seconds too slow for the typical boy and 34 seconds too slow for the typical girl.
What 1600 should a 17:00 cross country boy run in the spring?
Boys who ran 17:00 to 17:30 on New Hampshire’s slow championship course ran a median 4:40 at the spring divisional championship. Half landed between 4:45 and 4:31. A race calculator says 5:00. On a faster course, expect a little slower.
What 3200 can a 20:00 cross country girl run?
Girls who ran 20:00 to 20:30 on the same course ran a median 11:51 in the spring, with half between 12:06 and 11:36. A race calculator says 12:32.
How does a 3200 compare with two 1600s?
For runners who raced both events at the same spring championship, the 3200 came in a median 58 seconds slower than twice the 1600. If you are deciding whether an athlete should double in the 1600 and 3200, start there.
Should I use season bests or championship times?
Championship times. These ranges were built from championship races on both ends, November and May. Feed them a season best and every goal comes out too fast.
Does this work for middle school runners?
The data does not say. Every runner in it was racing a high school championship. Treat any middle school number from these ranges as a guess.
How the data was built
Every number in this article comes from public results posted by Lancer Timing, which times the New Hampshire (NHIAA) championships.
The fall races. The divisional cross country championships at Derryfield Park in Manchester, 2014 through 2025, all three divisions, boys and girls. That is 8,905 finishes over 11 seasons. There is no fall 2019 in the set. Spring 2020 was cancelled, so there was nothing to pair it with.
The spring races. The 1600 and 3200 at the divisional track championships, 2015 through 2026, skipping 2020. That is 1,972 performances.
The match. Each spring performance was paired with the same runner’s cross country race the fall before: same sex, same name, same school, same grade where the results list one. Small spelling differences between meets were allowed. Any spring result that could match more than one fall runner was dropped. 1,608 of the 1,972 matched (82%), from 824 different runners. A runner who raced both the 1600 and the 3200 counts once in each event.
The course comparison. The NHIAA Meet of Champions, one week after divisionals, at Mine Falls Park in Nashua (2014 through 2020) and Hills House in Hudson (2022 through 2025). 2,670 pairs of races by the same runners. Fall 2021 is left out because its results file has no readable text. The gap swung by year: close to zero in 2022, more than a minute in 2024.
The race calculator. “Race calculator” means the Daniels and Gilbert VDOT equations, the math behind most online race calculators. Each championship time went in as if it were a flat 5K.
The ladder. Floor, target and stretch are the 75th, 50th and 25th percentile spring times in each band. Three quarters of the band ran the floor or faster. Half ran the target or faster. A quarter ran the stretch or faster.
What the data cannot tell you.
- It only sees runners who made a spring divisional final. In the fastest bands that is most of them: 83% of boys under 16:30 and 86% of girls under 19:00. In slower bands it is a minority, and the ones who made it tend to be the ones who improved. Read those rows as optimistic.
- It cannot separate the course from the winter. Hills and footing, and five months of growth and training, land in the same number. Nobody in the set ran a flat 5K the same fall.
- Championship races are not time trials. Some finals are tactical. A sit-and-kick 1600 makes a runner look less fit than they were.
- It is one course in one state. For anywhere else, adjust for your course or build your own table.
- It does not know what anyone did over the winter. Some ran an indoor season. Some played basketball. Some took three months off. The ranges include all of them.
Keep reading
- The post-season debrief: questions to ask every runner before winter. Break length, path and level, and the health flags.
- How long runners should take off after cross country. The break that comes before any of this.
- Winter training for high school distance runners. Both paths, all four levels, twenty weeks.
- 1000m, 1500m or 3000m: choosing indoor events. For the athletes who race before May.
- Jack Daniels’ VDOT system. Where race-based paces started, and where they still work.
Sources
- Lancer Timing Services. NHIAA results archive: divisional cross country championships, Meet of Champions, and divisional track championships, 2014 to 2026.
- Daniels J, Gilbert J. Oxygen Power: Performance Tables for Distance Runners. Tempe, AZ; 1979.
- MileSplit. Future Success: Comparing Top 5K Boys To Track Seasons. A related look at top boys only.
Goals in this article are planning ranges for healthy athletes, not promises.